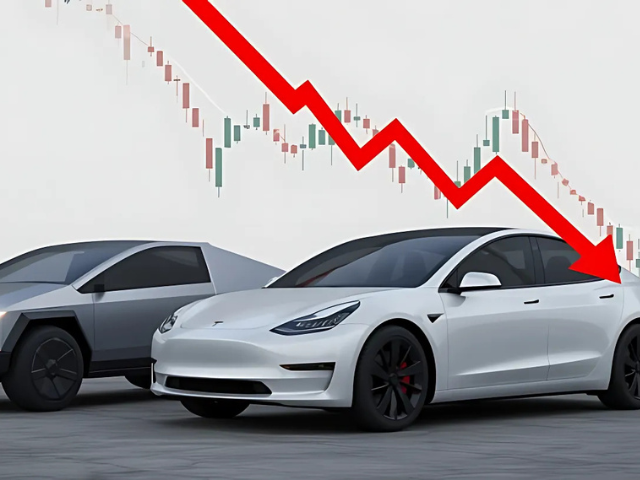
Tesla’s share price has shown a technical pattern known as the “death cross,” often interpreted as a bearish signal for future performance. The development comes amid ongoing market volatility driven by trade tariffs and broader economic uncertainty, placing further scrutiny on the electric vehicle manufacturer and its leadership.
According to Business Insider, Tesla’s 50-day moving average dropped below its 200-day moving average this week, triggering what is known as a “death cross” — a chart pattern often linked to downturns in stock performance. Though not universally accepted as a definitive indicator, the pattern typically suggests waning investor confidence.
Tesla is not alone. The S&P 500 and Nasdaq 100 also exhibited similar patterns on Monday, amid fluctuating market conditions linked to tariff-related tensions and policy shifts. These developments follow weeks of instability that have impacted multiple sectors, particularly tech and automotive.
Tesla’s decline is notable. The company has lost over a third of its market value since the beginning of 2025, despite intermittent gains tied to speculation around U.S. trade policy. CEO Elon Musk’s public profile and political commentary have added to market uncertainty.
While Musk secured brief positive exposure earlier this year through a White House appearance, widespread protests and negative sentiment have reportedly weighed on the company’s long-term outlook.
Despite the attention surrounding “death crosses,” analysts caution against overreliance on such patterns. Reuters reported that in about half of cases where the pattern appears, the stock or index has already bottomed out, rather than being on the brink of a steeper decline.
Still, the convergence of technical indicators and macroeconomic pressures raises questions about the direction of Tesla and other key players in the market as the second quarter unfolds.


